Metrics
Metrics are optional. Dashmark can show Docker CPU, memory, and network usage for Docker-backed cards, plus metrics from supported service APIs.
Browse the metrics catalogue for supported services, available metrics, inputs, and credentials.
Metric types
Section titled “Metric types”| Type | Best for | Configuration |
|---|---|---|
| Container metrics | CPU, memory, and network usage for a Docker container. | Docker labels or YAML. |
| Library metrics | Values from a supported service API. | Docker labels or YAML. |
| Custom metrics | Values from an API not covered by the library. | YAML. |
Standalone YAML cards support library and custom metrics, but not container metrics.
Configure card metrics
Section titled “Configure card metrics”Docker-backed cards show CPU, memory, and network usage out of the box. Set SHOW_METRICS=false to disable metrics dashboard-wide.
When a card specifies metrics, it shows exactly the entries listed. The built-in resource entries are cpu, memory, and network; library entries use provider/metric keys; other entries are custom metrics.
The metrics panel follows the order of entries in the configuration, including built-in, library, and custom metrics.
labels: dashmark.metrics: cpu,memory,radarr/queueradarr: metrics: entries: cpu: {} memory: {} radarr/queue: {}Omit cpu, memory, and network to show only library or custom metrics.
To disable all metrics for one card, use none:
labels: dashmark.metrics: noneradarr: metrics: noneDashmark collects metrics every 10 seconds by default. Set METRICS_DATABASE_PATH to a mounted path such as /data/metrics.db to retain metric history when the Dashmark container is replaced.
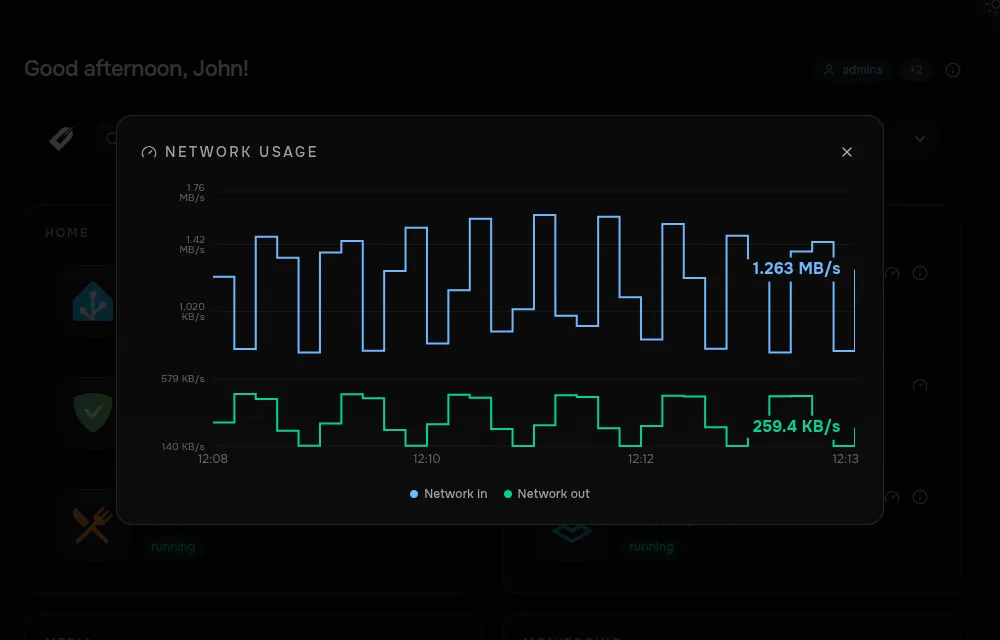
Select a metric from a card’s metrics panel to open its full history chart. Network usage displays inbound and outbound traffic together.
services: dashmark: volumes: - ./data:/data environment: - METRICS_DATABASE_PATH=/data/metrics.dbNext steps
Section titled “Next steps”- Library metrics for supported services.
- Custom metrics for your own HTTP APIs.
- Access control to restrict metric data for specific users.